|
News & Views item - July 2012 |
![]() University Funding - 1996 - 2010 a Group of Eight Snapshot. (July 5, 2012)
University Funding - 1996 - 2010 a Group of Eight Snapshot. (July 5, 2012)
The Group of Eight's
Backgrounder 27![]() from the beginning of the Howard government (1996 - 2007) and the Labor
government under Kevin Rudd (2007-2010).
from the beginning of the Howard government (1996 - 2007) and the Labor
government under Kevin Rudd (2007-2010).
The key findings of the paper, whose principal author, Mr Mike Teece, is Go8 Policy Director are:
The current Government has delivered funding increases for universities. Improved indexation will deliver further real increases from 2012.
Over the longer term, Commonwealth funding for universities has varied. Spending cuts and funding increases have followed one another. Funding boosts tend not to be maintained in real terms over time.
Considering growth in the scale of the sector, universities are not much better off than they were in 1996.
The funding data does not suggest that universities have done markedly better under governments of either political party.
Rather, the data points to the limits of any government’s fiscal capacity to maintain adequate levels of funding to sustain quality in a post-mass higher education system.
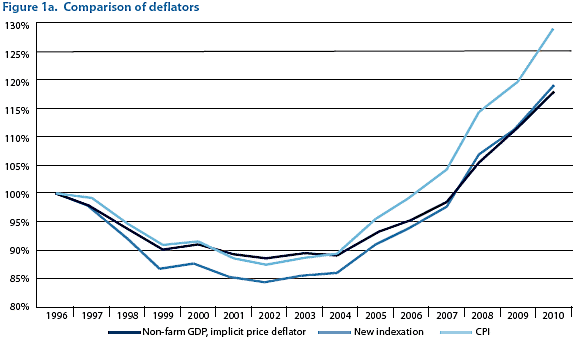
Figure 1a shows growth in Commonwealth funding (recurrent and other) to universities from 1996, comparing the effect of using three different deflators (CPI, non-farm GDP implicit price deflator, and the new higher education funding indexation factor).
In nominal terms, Commonwealth funding has grown by 86% since 1996 (though it
fell even in nominal terms between 1996 and 1999). Deflating the figures by CPI
gives a real increase of 29%. Using the non-farm GDP implicit price deflator
reduces the increase to 18% - almost identical to the figure derived using the
new indexation factor (19%).

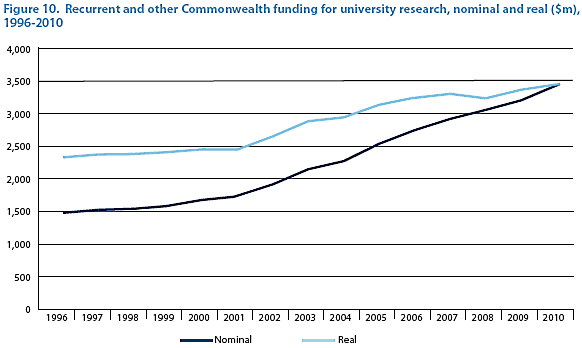
Combining the recurrent research funding with the non-recurrent funding yields the data series shown in Figure 10 below. In real terms, research funding increased strongly from 2001 before dipping in 2008. By 2010, growth in research funding was back to maintaining parity with inflation.

The conclusions of the backgrounder are given below:
Time series data on Commonwealth Government funding for
universities show that there has been a real increase in aggregate funding over
the past few years. However, different components of funding have shown very
different trajectories. Funding for learning and teaching declined from 1996 to
2004, before recovering to better than 1996 levels in 2010. Some of the recent
gains are due to enrolment growth: on a per student basis funding for learning
and teaching in 2010 was at about 1996 levels. Research block grants have been
fairly flat, since boosts in funding levels in 2001 eventually failed to keep
pace with inflation. Other research funding (including competitive grants) has
grown strongly and increased as a share of all research funding. Capital funding
fell slightly in real terms before a big drop in the mid 2000s. Since 2008,
capital funding has exceeded earlier levels, thanks to a large injection of new
money since 2008. However, much of the new funding was for new buildings –
adding to already large maintenance backlogs – and required universities to put
up matching funding.
Improved indexation will further increase real funding in 2012. Budget
projections show a further increase in the real value of CGS funding per
student, due to the very welcome introduction of more generous indexation in
2012. But even the Government’s projections concede that it will be difficult to
maintain the funding boost in real terms.
The Government has shown little sign of willingness to address under funding of
CSPs [Commonwealth Supported Places] identified by both the Bradley and
Lomax-Smith Reviews. Universities’ capital maintenance backlog remains, and
enrolment growth means increased infrastructure costs. Funding for major
research infrastructure has terminated, without a clear and developed plan to
replace it.
Time series funding data show that Governments of both parties have made efforts
to improve funding for universities at different times and in different ways.
But governments of both parties have also found themselves unable to fund all of
the sector’s financial needs, and have had to make Budget decisions that have
been unpopular with the sector.
The data in this paper point to the limits of any government’s capacity to
sustain adequate levels of funding for a mass (and post-mass) higher education
system. Future governments may not be able to restore real funding rates per
student to an acceptable level, while also adequately funding capital and
research, within the current funding framework.
What this backgrounder does not do is compare the funding by the Australian commonwealth government to that of its OECD cohort, or our Asian neighbours such as China, India, Korea Singapore or Taiwan.