|
News & Views item - September 2004 |
![]() Australian
Bureau of Statistics Releases Latest Figures for Research and Experimental
Development for All Sectors. (September 13, 2004)
Australian
Bureau of Statistics Releases Latest Figures for Research and Experimental
Development for All Sectors. (September 13, 2004)
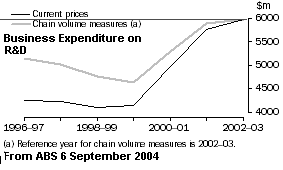
Following on last week's release by the ABS of Business Expenditure on Research and Development (BERD) today it added data for contributions from the government and private non-profit sectors. Surprisingly, while that material released on the ABS web site regarding BERD provided an analysis not only in terms of current dollars it also allowed meaningful temporal comparisons by providing chain volume measure. The chain volume measure is not included in today's release. As is obvious from the first chart (below left), it makes a difference.
Bradley Smith, Executive Director of the Federation of Australian Scientific and Technological Societies has provided the summarising tables below, and makes the following observations:
The increase in non-business R&D is driven by university R&D spend and it is controversial how much of this figure is real, given the assumptions on how much time teaching and research academics now really do on research given the major deterioration on staff/student ratios, increased bureaucracy etc. Furthermore, if anything the increase is a testament to the increased productivity of academics - but it is entirely unreasonable to expect continued growth in higher education contribution to the national R&D effort without substantial increases in investment in our universities.
The increase in GERD is at the low/middle end of the changes in OECD countries spend ie not exactly clawing our way back toward the average (the changes are outlined in table B the change column is FASTS' work the other two are ABS data)
The data for 2003/4, 2004/5 is likely to fall again as Government spend has not maintained its share relative to GDP (ie dropped to 0.62% from 0.66% in 2004/5 budget).
The ABS R&D summery by sector is available at
http://www.abs.gov.au/AUSSTATS/abs@.nsf/lookupMF/07E66F957A46864BCA25695400028C64

|
Table A: GROSS EXPENDITURE ON R&D ($m) (r = subject to possible slight revision)
Table B: GERD/GDP RATIOS OF OECD COUNTRIES
NB: This table lists OECD countries with comparable data - not all OECD countries are listed. Source for both tables is ABS 8112.0 Research and Experimental Development, All Sector Summary, Australia (13/9/04) |